
Construction Spending Slows, Power Takes the Lead
Recently, the US Census released the results of its monthly Value of Construction Put in Place Survey. The survey provides estimates of the total dollar value of construction work done in the U.S. This data includes design and construction spending for public and private projects.
The seasonally adjusted annual rate of $2.16 trillion for June 2026 represents a monthly change of -0.1% and decrease of 3.2% year over year (not adjusted for inflation). With recent revisions of the data, this is now the 11th consecutive month of year-over-year decline in total construction spending. The second quarter of 2026 shows the industry struggling with meaningful broad-based growth, with Private spending down -4.7% and Public spending up 1.7% year over year, respectively.
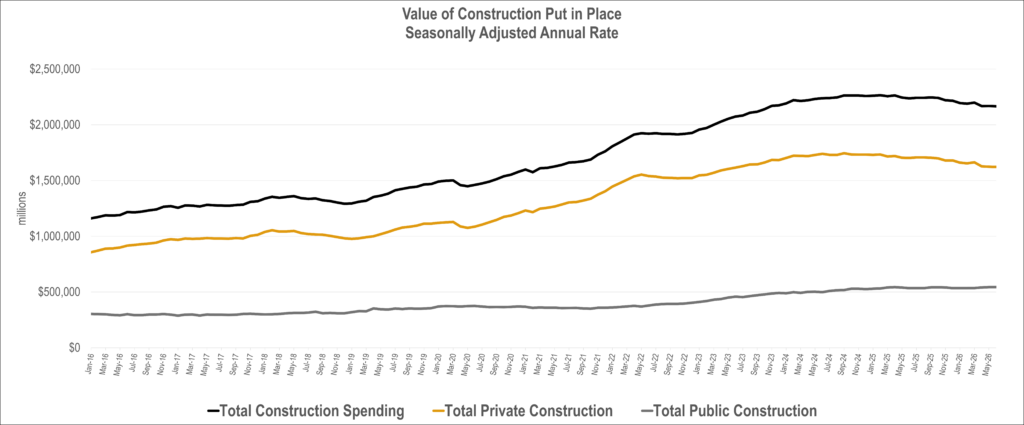
Source: US Census Value of Construction Put in Place Survey August 3, 2026 release
The decline in total construction spending mirrors a general U.S. economic slowdown, with advanced estimates for real U.S. GDP growth for the 2nd quarter of 2026 at 1.5%, down from 2.1% for 2026 Q1.
EXPLORE THE DATA WITH OUR INTERACTIVE DASHBOARD
Data shows that in aggregate, construction spending peaked in February 2025. Below the headline number, performance in individual markets has shown considerable variability. The Residential sector continues to struggle with higher borrowing costs; current mortgage rates are approximately 6.6%. These are the highest since August of 2025. As such, this sector is down -4.7% year over year. The Nonresidential market struggles as well, down -2.1% year over year. This is due to high costs of capital in addition to changes in Federal policy as well as broader stector-wide trends.
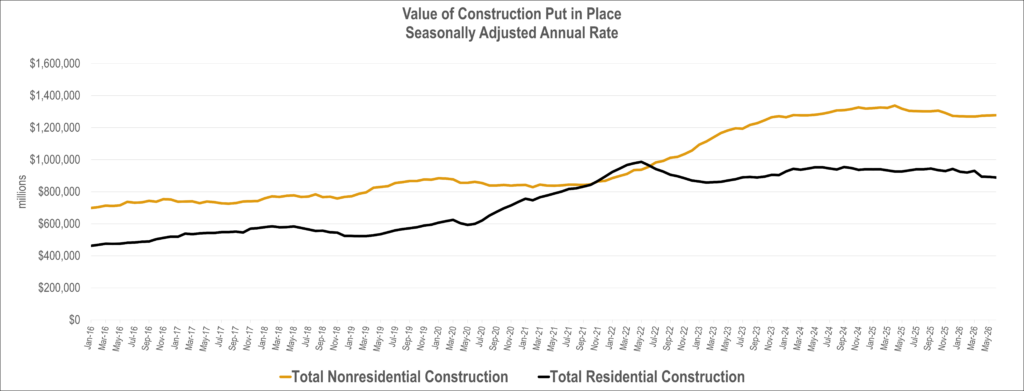
Source: US Census Value of Construction Put in Place Survey August 3, 2026 release
With respect to year-over-year growth in individual markets, the midway point 2026 is showing a bifurication of markets with 10 experiencing growth and 7 experiecing a contraction. The 7 declining markets were the same that had year-over- year declines at the end of 2025 with the exception of Highway and street, which is now seeing positive growth for 2026.
For the first time since the end of 2021, the Power market is now the largest non-residential market. Other top growth markets include the Office sector, up 5.8% year to date. This is due to the substantial growth in Data Centers, which are up 29.4% compared to last year. Religious, Conservation and Development, and Amusement and Recreation round out the 5 largest year-to-date increases.
Sectors that are in decline are lead by Manufacturing, which is down 22.1% year to date and no longer the largest market in terms of total value. As noted above, sectors that struggled the previous 3 years due to the higher interest rate environment continue to decline, including Residential and Commercial, with Public Safety, Education, and Lodging also negative year to date after ending 2026 Q1 with positive growth.