
Follow the Money: Where Construction Growth Remains
Recently, the US Census released the results of its monthly Value of Construction Put in Place Survey. The survey provides estimates of the total dollar value of construction work done in the U.S. This data includes design and construction spending for public and private projects.
US construction spending dropped sharply after a brief bright spot in August. Total spending decreased to a seasonally adjusted annual rate of $2.19 trillion. This represents a month-over-month decrease of -1.9% and a year-over-year decrease of -2.7% (not adjusted for inflation). This is now 14 consecutive months of year-over-year declines in total construction spending. Total Private construction is down -3.8%, compared to Public spending which is up 1.0% year over year.
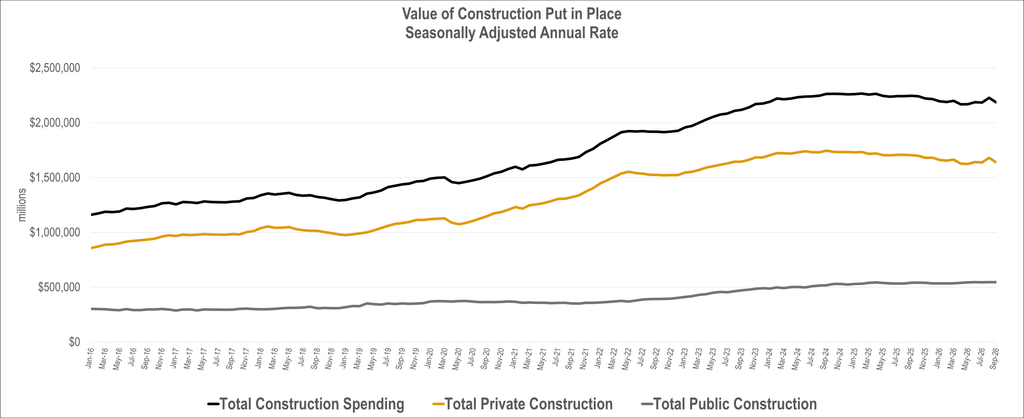
Source: US Census Value of Construction Put in Place Survey November 1, 2026 release
The sudden reversal from August’s month-over-month increase is mainly due to the sudden drop in Residential construction, following the Federal Reserve’s interest rate increase at its September 16th, 2026, meeting. The construction decline contrast’s sharply with the U.S. GDP Q3 estimate of 3.4% real growth released at the end of October. A key focus for the end of 2026 will be whether the federal reserve raises interest rates again in December.
EXPLORE THE DATA WITH OUR INTERACTIVE DASHBOARD
Data shows that in aggregate, construction spending peaked in February 2025. Below the headline number, performance in individual markets has shown considerable variability. As noted, the Residential sector continues to struggle with higher borrowing costs and is down 8.8% year to date. The Nonresidential market has rebounded from declines at the start of the year to be up 1.8% year over year.
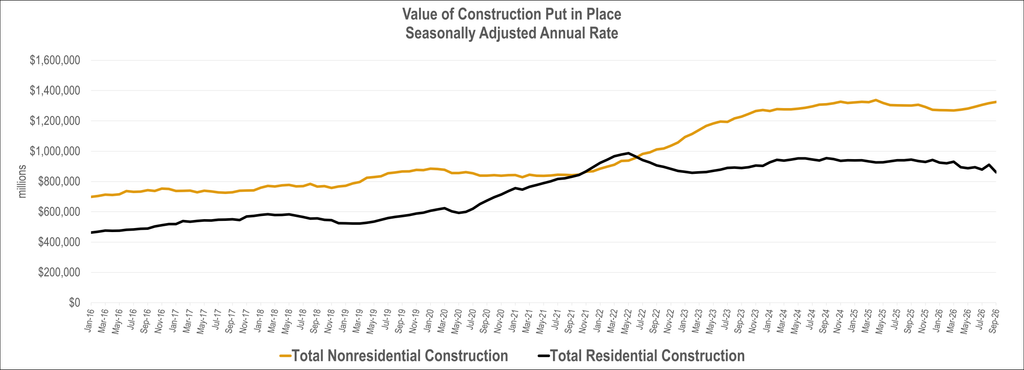
Source: US Census Value of Construction Put in Place Survey November 1, 2026 release
With respect to year-to-date growth in individual markets, 2026 is showing a continued divide with 10 markets experiencing growth and 7 experiencing a contraction.
The Power market continues to be the largest nonresidential market and has now grown 5.9% year to date. Other top growth markets include the Office sector, up 14.5% year to date. This is due to the substantial growth in Data Centers, which are up 49.1% compared to last year for a total of $54.2b year to date. Religious, Conservation and development, and Amusement and recreation round out the 5 largest year-to-date increases.
Sectors in decline are lead by Manufacturing, which is down 21.3% year to date, though is the 2nd largest nonresidential market with total spending at $130.4b year to date. Sectors affected by higher costs of capital due to higher interest rates continue to contract, including Residential, Commercial and Lodging. Public Safety is also negative year to date.


